Next: 2.6 Output Modules Up: 2. Configuring Snort Previous: 2.4 Event Processing Contents
Snort can provide statistics on rule and preprocessor performance. Each require only a simple config option to snort.conf and Snort will print statistics on the worst (or all) performers on exit. When a file name is provided in profile_rules or profile_preprocs, the statistics will be saved in these files. If append is not specified, a new file will be created each time Snort is run. The filenames will have timestamps appended to them. These files will be found in the logging directory.
To use this feature, you must build snort with the -enable-perfprofiling option to the configure script.
    config profile_rules: \
        print [all | <num>], \
        sort <sort_option> \
        [,filename <filename> [append]]
checks matches nomatches avg_ticks avg_ticks_per_match avg_ticks_per_nomatch total_ticks
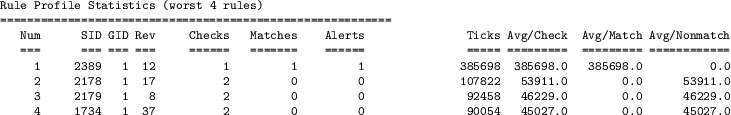
Snort will print a table much like the following at exit.
Configuration line used to print the above table:
config profile_rules: print 4, sort total_ticks
The columns represent:
Interpreting this info is the key. The Microsecs (or Ticks) column is important because that is the total time spent evaluating a given rule. But, if that rule is causing alerts, it makes sense to leave it alone.
A high Avg/Check is a poor performing rule, that most likely contains PCRE.
High Checks and low Avg/Check is usually an any-![]() any rule with few rule
options and no content. Quick to check, the few options may or may not match.
We are looking at moving some of these into code, especially those with low
SIDs.
any rule with few rule
options and no content. Quick to check, the few options may or may not match.
We are looking at moving some of these into code, especially those with low
SIDs.
By default, this information will be printed to the console when Snort exits. You can use the "filename" option in snort.conf to specify a file where this will be written. If "append" is not specified, a new file will be created each time Snort is run. The filenames will have timestamps appended to them. These files will be found in the logging directory.
    config profile_preprocs: \
        print [all | <num>], \
        sort <sort_option> \
        [, filename <filename> [append]]
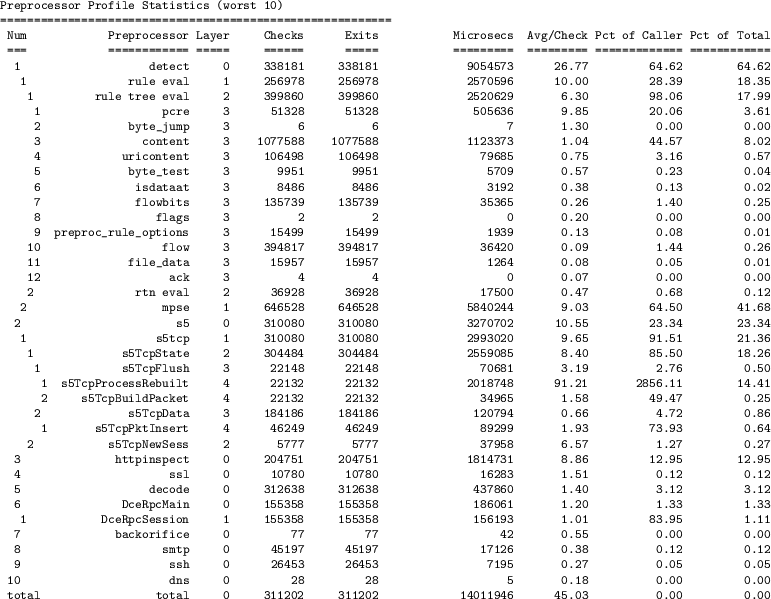
Snort will print a table much like the following at exit.
Configuration line used to print the above table:
    config profile_preprocs: \
        print 10, sort total_ticks
The columns represent:
Because of task swapping, non-instrumented code, and other factors, the Pct of Caller field will not add up to 100% of the caller's time. It does give a reasonable indication of how much relative time is spent within each subtask.
By default, this information will be printed to the console when Snort exits. You can use the "filename" option in snort.conf to specify a file where this will be written. If "append" is not specified, a new file will be created each time Snort is run. The filenames will have timestamps appended to them. These files will be found in the logging directory.
To use PPM, you must build with the -enable-ppm or the -enable-sourcefire option to configure.
PPM is configured as follows:
    # Packet configuration:
    config ppm: max-pkt-time <micro-secs>, \
        fastpath-expensive-packets, \
        pkt-log, \
        debug-pkts

    # Rule configuration:
    config ppm: max-rule-time <micro-secs>, \
        threshold count, \
        suspend-expensive-rules, \
        suspend-timeout <seconds>, \
        rule-log [log] [alert]
Packets and rules can be configured separately, as above, or together in just one config ppm statement. Packet and rule monitoring is independent, so one or both or neither may be enabled.
Packet Configuration Options
max-pkt-time <micro-secs>
fastpath-expensive-packets
pkt-log
debug-pkts
Rule Configuration Options
max-rule-time <micro-secs>
threshold <count>
suspend-expensive-rules
suspend-timeout <seconds>
rule-log [log] [alert]
Example 1: The following enables packet tracking:
config ppm: max-pkt-time 100
The following enables rule tracking:
config ppm: max-rule-time 50, threshold 5
If fastpath-expensive-packets or suspend-expensive-rules is not used, then no action is taken other than to increment the count of the number of packets that should be fastpath'd or the rules that should be suspended. A summary of this information is printed out when snort exits.
Example 2:
The following suspends rules and aborts packet inspection. These rules were used to generate the sample output that follows.
    config ppm: \
        max-pkt-time 50, fastpath-expensive-packets, \
        pkt-log, debug-pkts

    config ppm: \
        max-rule-time 50, threshold 5, suspend-expensive-rules, \
        suspend-timeout 300, rule-log log alert
Sample Snort Startup Output
    Packet Performance Monitor Config:
      ticks per usec  : 1600 ticks
      max packet time : 50 usecs
      packet action   : fastpath-expensive-packets
      packet logging  : log
      debug-pkts      : disabled

    Rule Performance Monitor Config:
      ticks per usec  : 1600 ticks
      max rule time   : 50 usecs
      rule action     : suspend-expensive-rules
      rule threshold  : 5
      suspend timeout : 300 secs
      rule logging    : alert log
Sample Snort Run-time Output
    ...
    PPM: Process-BeginPkt[61] caplen=60
    PPM: Pkt[61] Used= 8.15385 usecs
    PPM: Process-EndPkt[61]

    PPM: Process-BeginPkt[62] caplen=342
    PPM: Pkt[62] Used= 65.3659 usecs
    PPM: Process-EndPkt[62]

    PPM: Pkt-Event Pkt[63] used=56.0438 usecs, 0 rules, 1 nc-rules tested, packet fastpathed
         (10.4.12.224:0 -> 10.4.14.108:54321).
    PPM: Process-BeginPkt[63] caplen=60
    PPM: Pkt[63] Used= 8.394 usecs
    PPM: Process-EndPkt[63]

    PPM: Process-BeginPkt[64] caplen=60
    PPM: Pkt[64] Used= 8.21764 usecs
    PPM: Process-EndPkt[64]
    ...
Sample Snort Exit Output
    Packet Performance Summary:
       max packet time       : 50 usecs
       packet events         : 1
       avg pkt time          : 0.633125 usecs
    Rule Performance Summary:
       max rule time         : 50 usecs
       rule events           : 0
       avg nc-rule time      : 0.2675 usecs